As a potential buyer or seller in today’s real estate market, it is important to understand the correlation between key metrics that can impact your decision-making process. Let’s delve into the data to provide a comprehensive analysis.
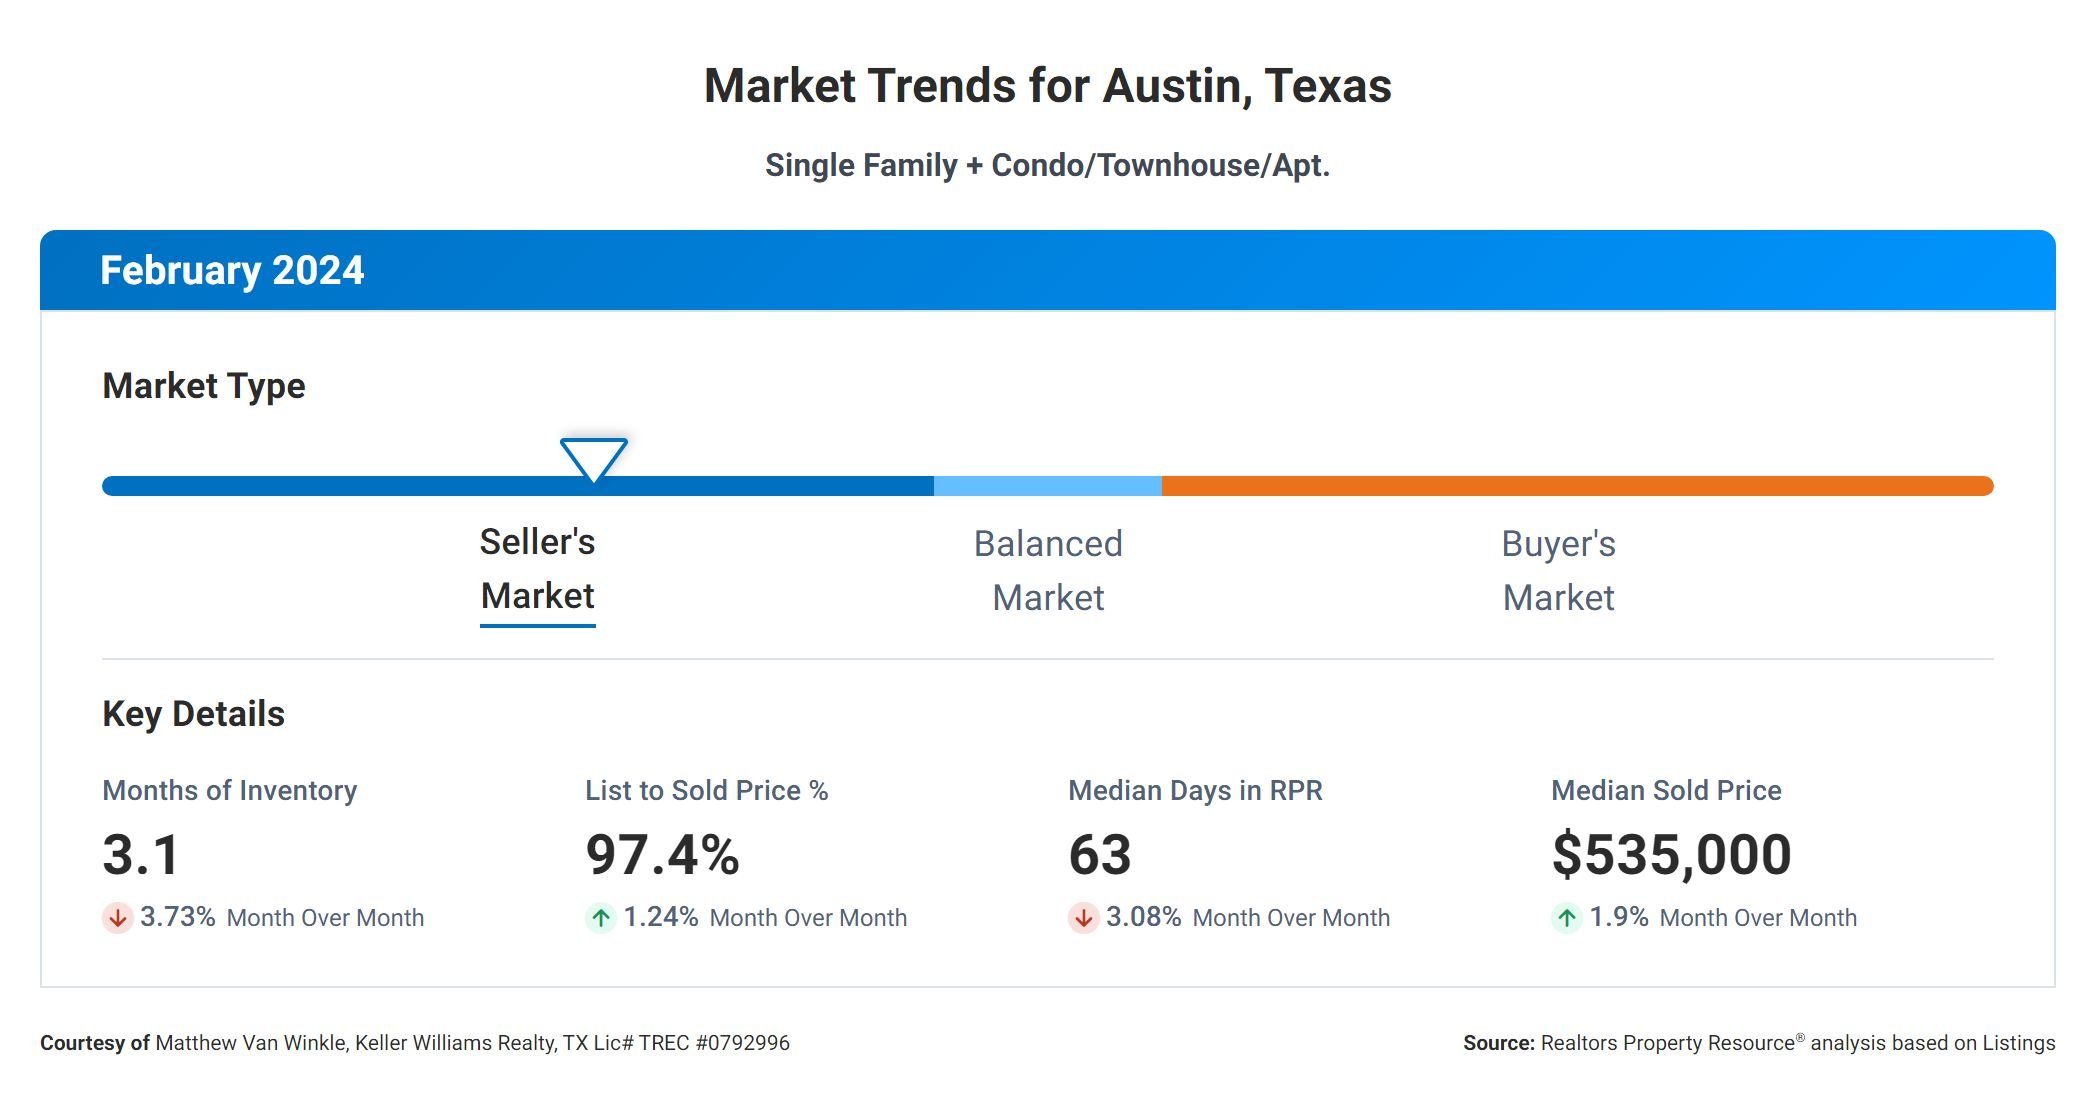
First, let’s look at the Months Supply of Inventory, which currently stands at 3.1. This metric indicates how long it would take for all current listings to be sold at the current sales pace. A lower supply of inventory typically signifies a seller’s market, where demand exceeds supply, putting sellers in a favorable position.
Next, the 12-Month Change in Months of Inventory is -17.55%, indicating a significant decrease in the supply of inventory compared to the previous year. This trend suggests a tightening of the market, potentially leading to increased competition among buyers and higher prices.
The Median Days Homes are On the Market is 63, indicating that homes are selling relatively quickly in this market. A shorter time on the market can be advantageous for sellers, as it may indicate high demand and competitive pricing.
The List to Sold Price Percentage is 97.4%, showing that homes are typically selling close to their listing price. This metric suggests that sellers are pricing their homes effectively and buyers are willing to pay close to the asking price.
Finally, the Median Sold Price is $535,000, providing insight into the average price at which homes are selling in this market. This information can be useful for both buyers and sellers in determining fair market value and negotiating strategies.
In summary, the data indicates a competitive real estate market with low inventory, fast-selling homes, and strong pricing. Buyers may face challenges in finding available properties, while sellers may benefit from favorable conditions for selling their homes. It is crucial for both parties to stay informed and work with a knowledgeable real estate professional to navigate this dynamic market successfully.